Tutorials
Here you can find tutorials for swan.
You can see how to create a new project, load a project, how the project files look like and so on.
Of course you can learn how to use swan’s tool bar functions as well.
Projects
Create a new project
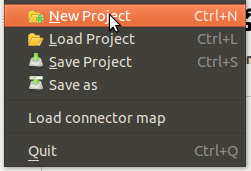
To create a new project you have to click on File->New Project or on the folder icon with the little plus on it.
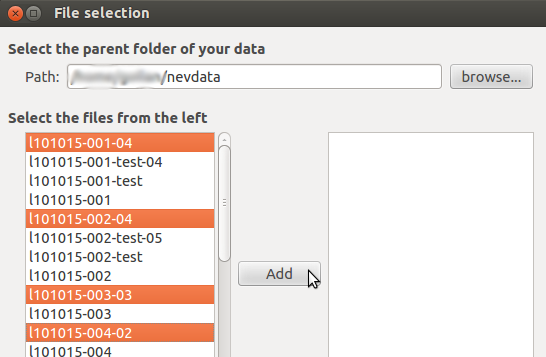
A dialog will open where you can choose a directory containing “.nev” files.
Just click on browse… and confirm the directory by clicking on Open.
You will now see a list of files on the left of the dialog.
Choose the files you want to load. “Ctrl-Click” and “Shift-Click” for multiple file selection are supported.
By clicking on Add the files will be added to the right list. These are the files that will be loaded.
If you want to add another file(s), you can just choose them and click Add again.
If you want to remove files from the right list, just select them and click Remove.
Now that you have your files selected, click on Ok and the project will be created.
The files will be loaded directly after that.
Load a project
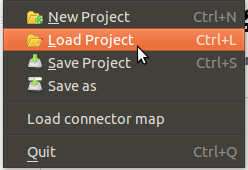
To load a project click on File->Load Project or on the folder icon with the little pencil on it and choose the project file.
Now click on Open and the project will be loaded.
Overview
Swapping units
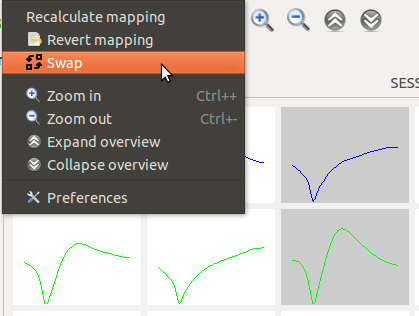
To swap units you have to click on Edit->Swap or on the swap icon.
Swapping is only allowed if you have two units selected which both are in the same session. Otherwise nothing will happen.
To select units just click on them.
Resizing and Zooming
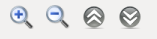
You can change the size of the overview plots by clicking on the loupe icon with the plus and the minus inside of it.
Or you click on Edit->Zoom in or Edit->Zoom out. The keyboard shortcuts Ctrl + and Ctrl - work as well.
To change the y-limits of the plots, just click on the icon with the two arrows that are pointing down or up.
Of course you can do it via menu, too. Therefore you have to click on Edit->Expand Overview or Edit->Collapse Overview.
Preferences

To open the preferences click on the screwdriver and screw-wrench icon or open it via menu by selecting Edit->Preferences.
General
Default project name: Sets the default name for the project file which will be used if you create a new project. The project file contains the (absolute) paths to the files with the data for this project.
Cache location: Sets the location for the cache files. Cache files are needed to load the data faster after loading it the first time.
Overview
Resizing: Sets the zoom in and zoom out steps for the overview plots. Look at Resizing and Zooming for more information.
Reranging: Sets the steps for changing the y-limits of the overview plots. Look at Resizing and Zooming for more information.
Views
2d view
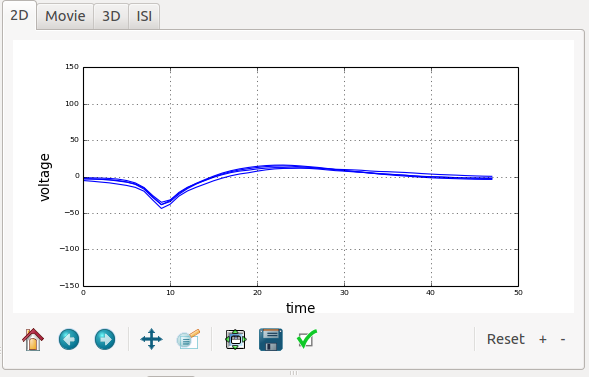
In this view you can see two-dimensional data from all units and sessions you loaded. The colors are the same as you see them in the overview. The mapping of the units are the same, too. With this view you can compare the mappings you made in the overview in detail. To better compare the units you can deselect complete rows of units (virtual units) by deselecting them in the units tab. In the layers tab you can choose which data you want to see.
Movie view
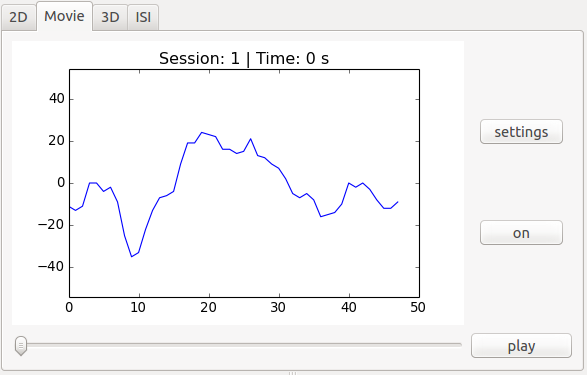
This view shows data (waveforms) of the units for all session. You can choose the unit rows (virtual units) to show via the units tab. By selecting off the button will turn to on and the data will be loaded. By selecting play you can see the data in a movie-like way, the plot will update itself automatically. To change the settings for this view select settings.
3d view
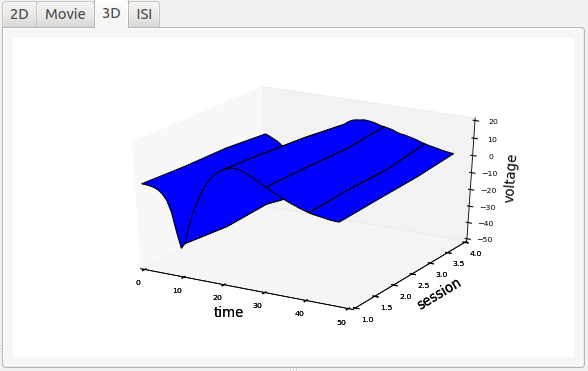
This view shows the data from one unit row (virtual unit) in a three-dimensional plot. To change the unit row (virtual unit) which is shown deselect the ones you don’t want to see in the units tab. It will be plotted the first selected row in the units tab. In the layers tab you can choose which data you want to see.
ISI view
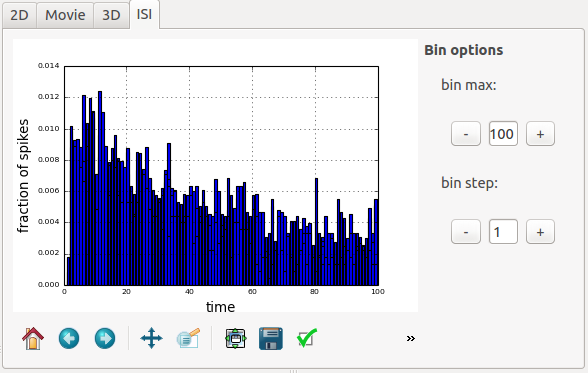
In this view histograms are plotted. You can see the inter-spike-interval histograms for the units and session. You can deselect unit rows (virtual units) in the units tab if you don’t want to see their data. You can choose different histogram data in the layers tab.
Virtual units view
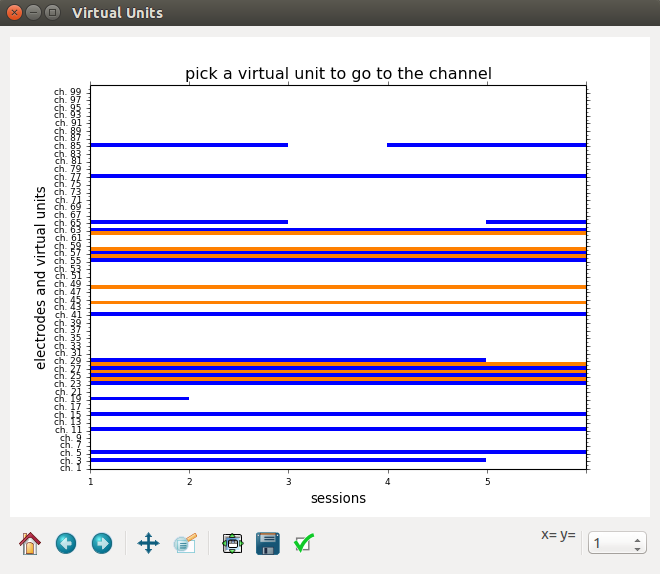
To see this view click on virtual units on the toolbar or select View->Virtual units. This view gives you an overview of existing virtual units. After you loaded an electrode and are done with the mapping you can save the project. Then this view will show the virtual units of that electrode. If you that the virtual unit is colored it means that there are existing units. Not existing units are not colored. You can change the number of shown virtual units by selecting an option in the bottom right corner of the view. If you select a virtual unit in the plot the electrode this virtual unit belongs to will be loaded. This will not work if you select the auto option.